Figures
Academic-style figures with automatic numbering and captions
Figures provide a way to display images with captions and automatic numbering, following academic publishing conventions.
Basic Usage
Use the figure shortcode to add a captioned image:
{{ figure(src="/images/nightingale.jpg", caption="Florence Nightingale's polar area diagram") }}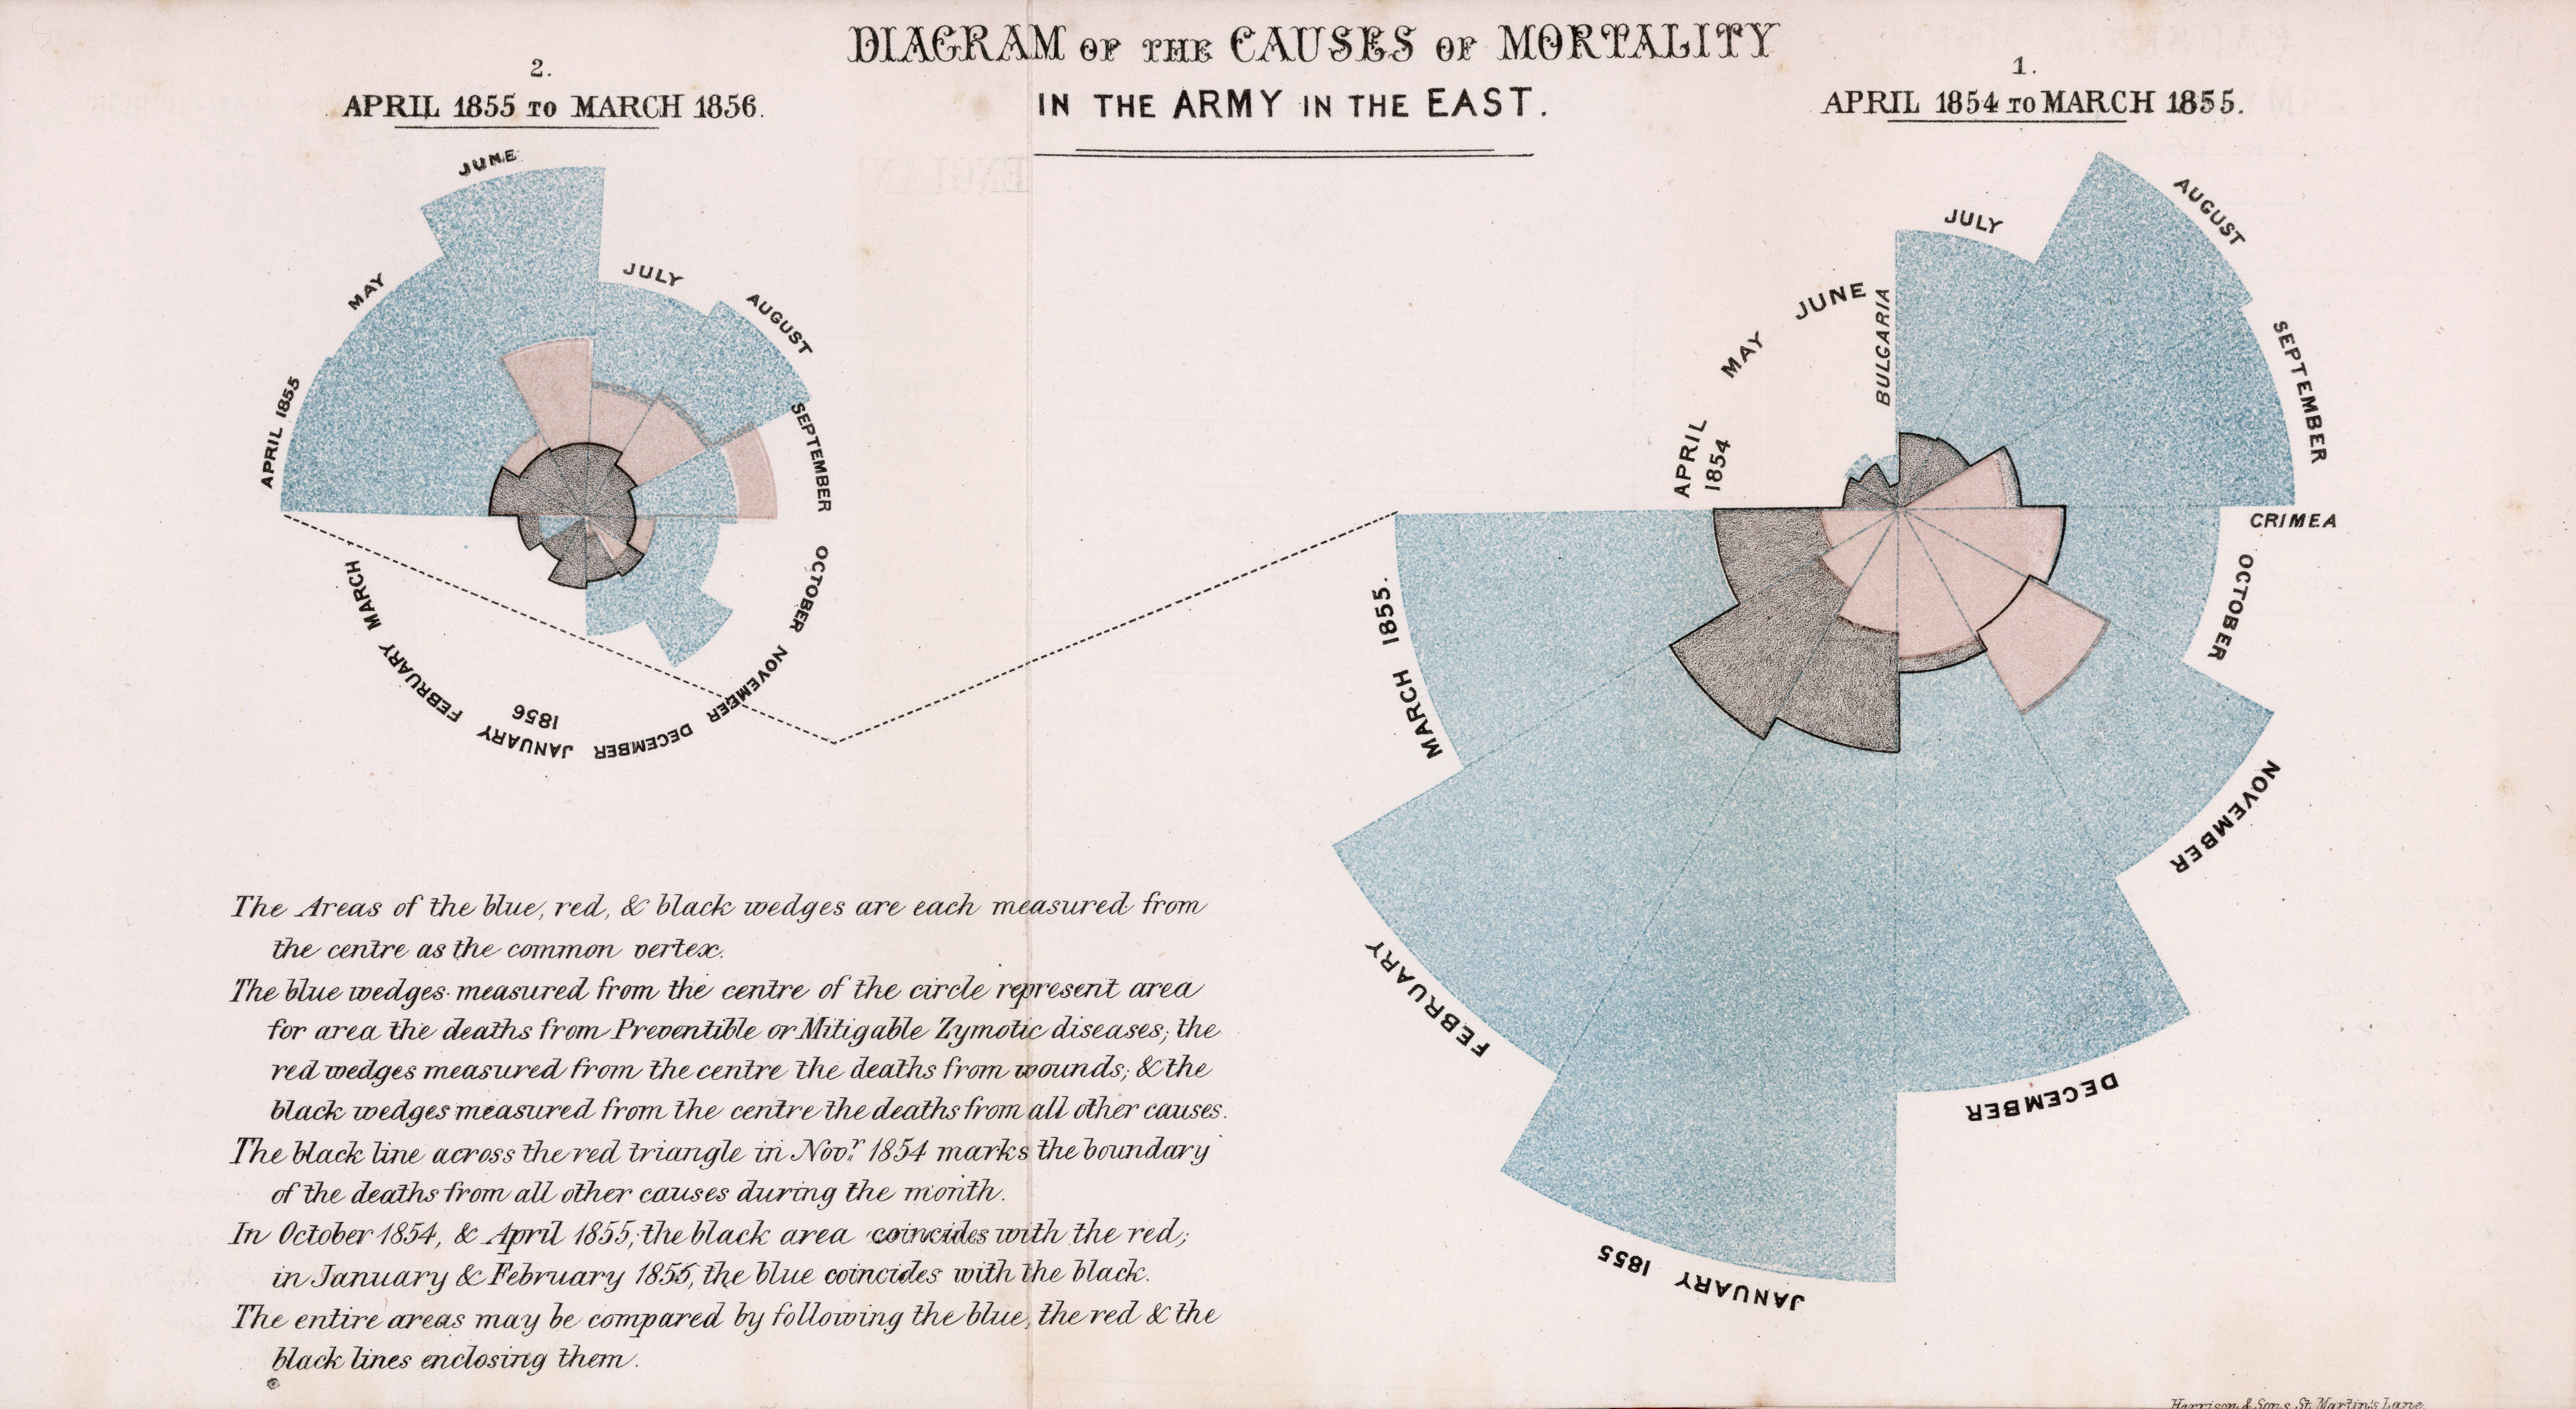
The figure number is generated automatically using CSS counters—you don't need to manage numbers manually.
Multiple Figures
When you add multiple figures, they're numbered sequentially:

Notice how the numbering continues automatically: Figure 1, Figure 2, Figure 3.
Parameters
The figure shortcode accepts these parameters:
| Parameter | Required | Description |
|---|---|---|
src | Yes | Path to the image file |
caption | No | Caption text (supports inline markdown) |
alt | No | Alt text for accessibility (defaults to caption) |
id | No | Custom ID for cross-references (defaults to fig-{n}) |
Custom IDs for Cross-References
You can assign a custom ID to reference a figure later:
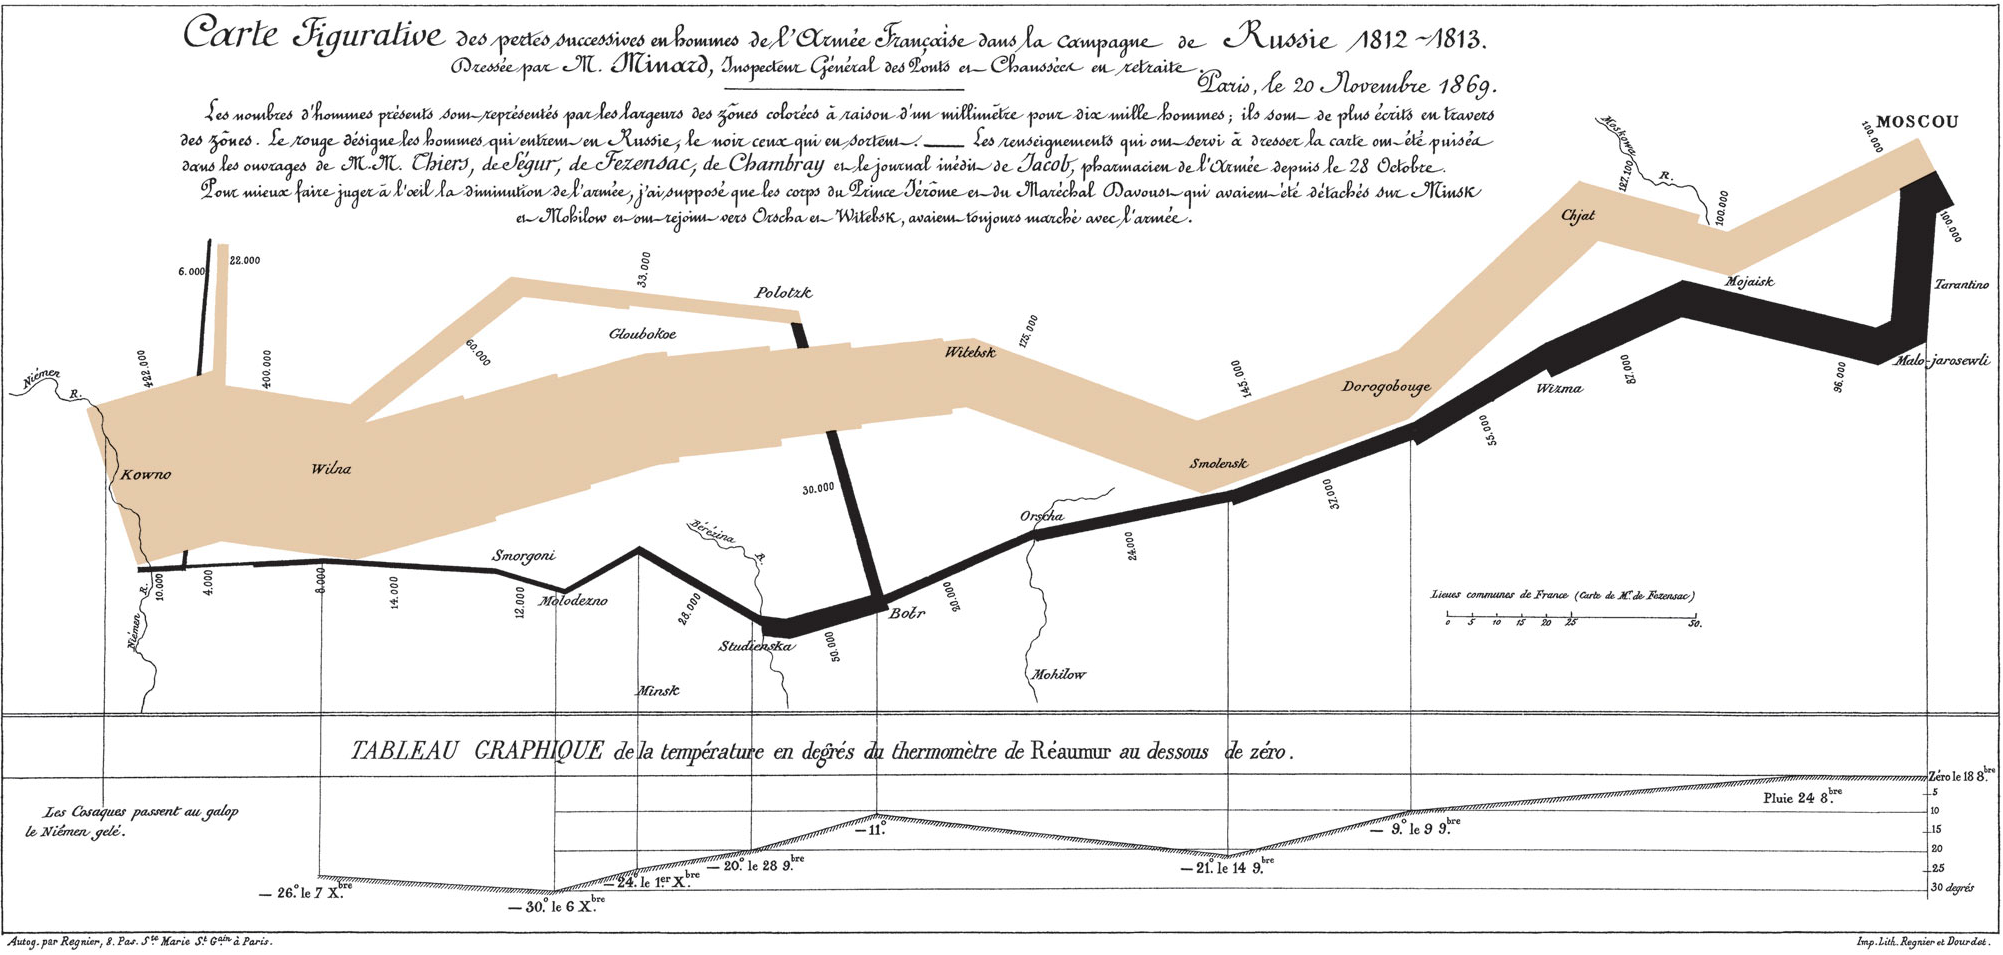
{{ figure(src="/images/minard.png", caption="Minard's famous visualization", id="fig-minard") }}

See [Figure 2](#fig-minard) for an example of narrative data visualization.
This creates an anchor you can link to from anywhere on the page. The link Figure 2 will scroll to the Minard figure above.
Captions with Markdown
Captions support inline markdown formatting:
You can use italics, bold, and even inline math in your captions.
Layout Behavior
Figures extend slightly into the sidenote margin on wide screens, giving images more room to breathe. On narrower viewports, they shrink to fit the content column.
Figures also push any floating sidenotes down to prevent overlap, similar to how code blocks and tables behave.